Key Monitoring Metrics of TiKV
If you use TiUP to deploy the TiDB cluster, the monitoring system (Prometheus/Grafana) is deployed at the same time. For more information, see Overview of the Monitoring Framework.
The Grafana dashboard is divided into a series of sub dashboards which include Overview, PD, TiDB, TiKV, Node_exporter, Performance_overview, and so on. A lot of metrics are there to help you diagnose.
You can get an overview of the component TiKV status from the TiKV-Details dashboard, where the key metrics are displayed. According to the Performance Map, you can check whether the status of the cluster is as expected.
This document provides a detailed description of these key metrics on the TiKV-Details dashboard.
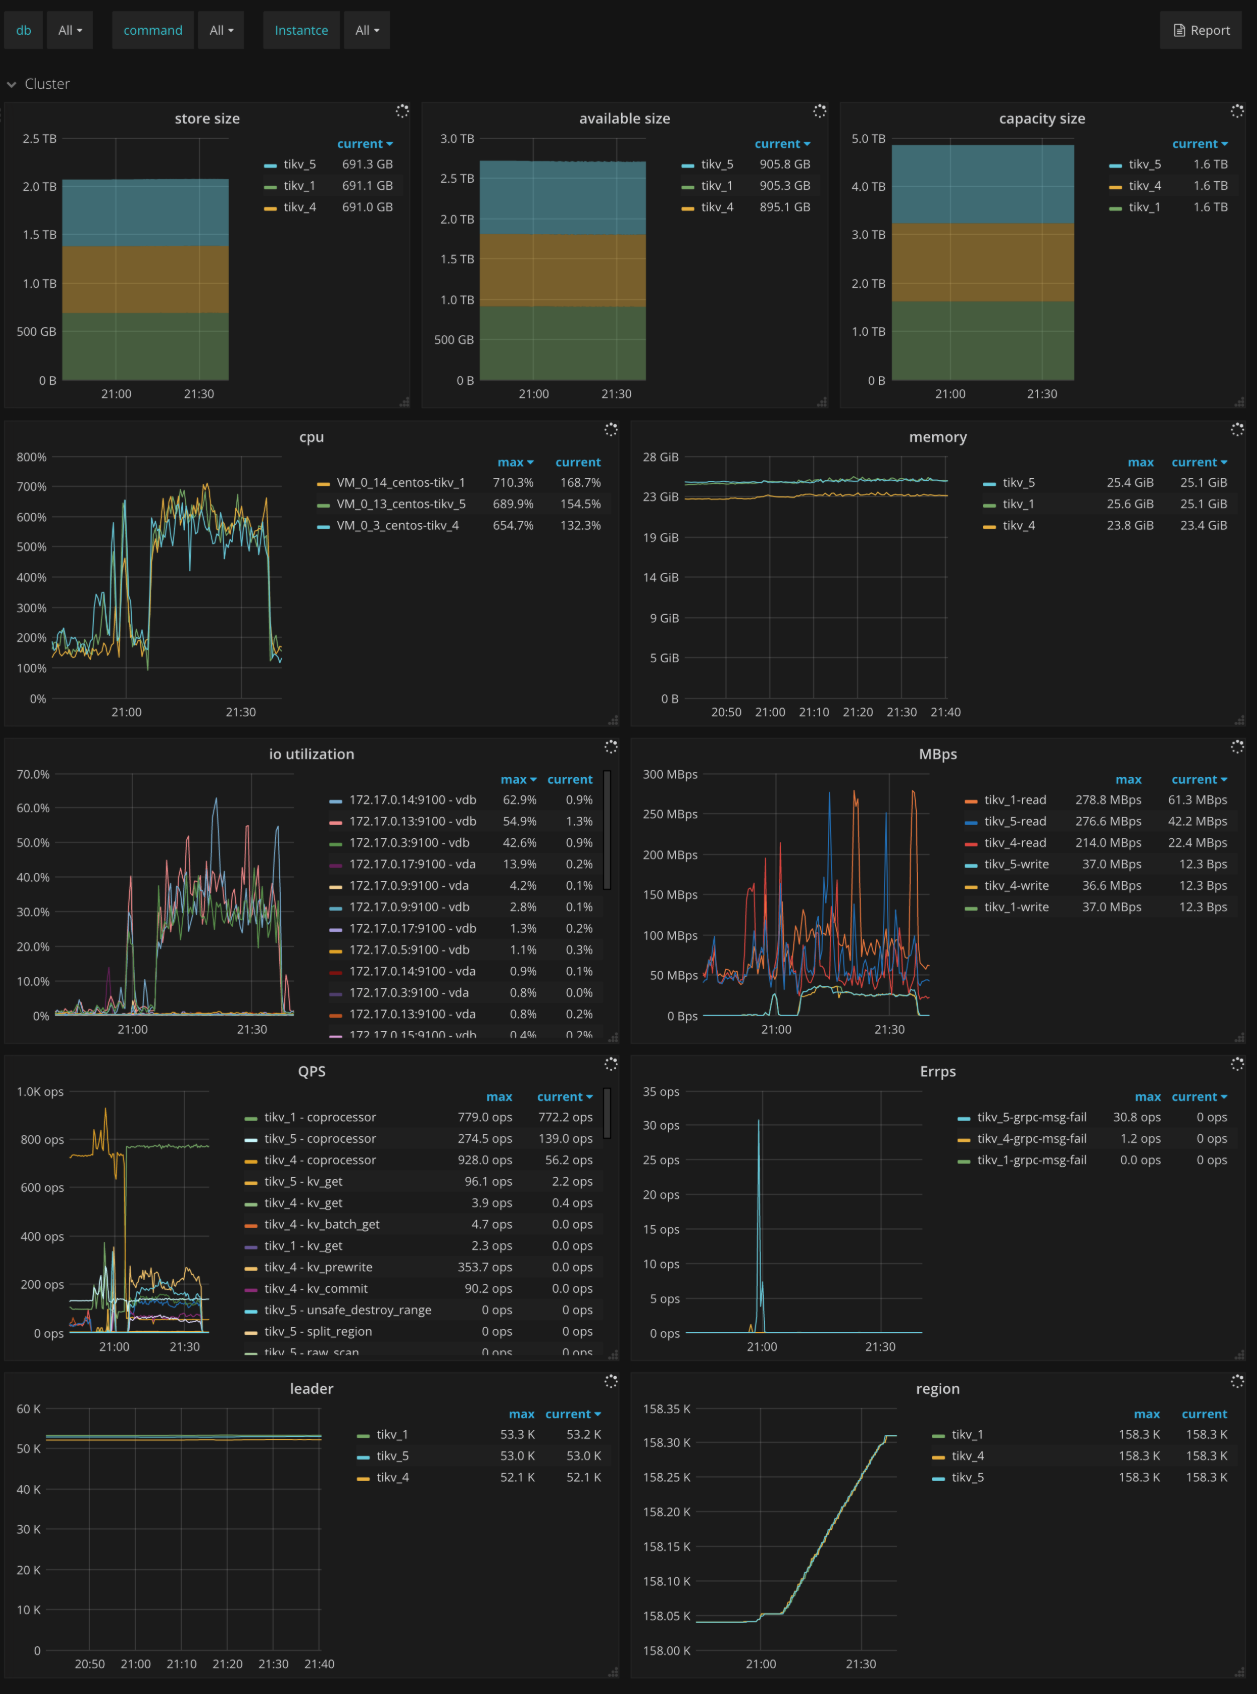
Cluster
- Store size: The storage size per TiKV instance
- Available size: The available capacity per TiKV instance
- Capacity size: The capacity size per TiKV instance
- CPU: The CPU utilization per TiKV instance
- Memory: The memory usage per TiKV instance
- IO utilization: The I/O utilization per TiKV instance
- MBps: The total bytes of read and write in each TiKV instance
- QPS: The QPS per command in each TiKV instance
- Errps: The rate of gRPC message failures
- leader: The number of leaders per TiKV instance
- Region: The number of Regions per TiKV instance
- Uptime: The runtime of TiKV since last restart
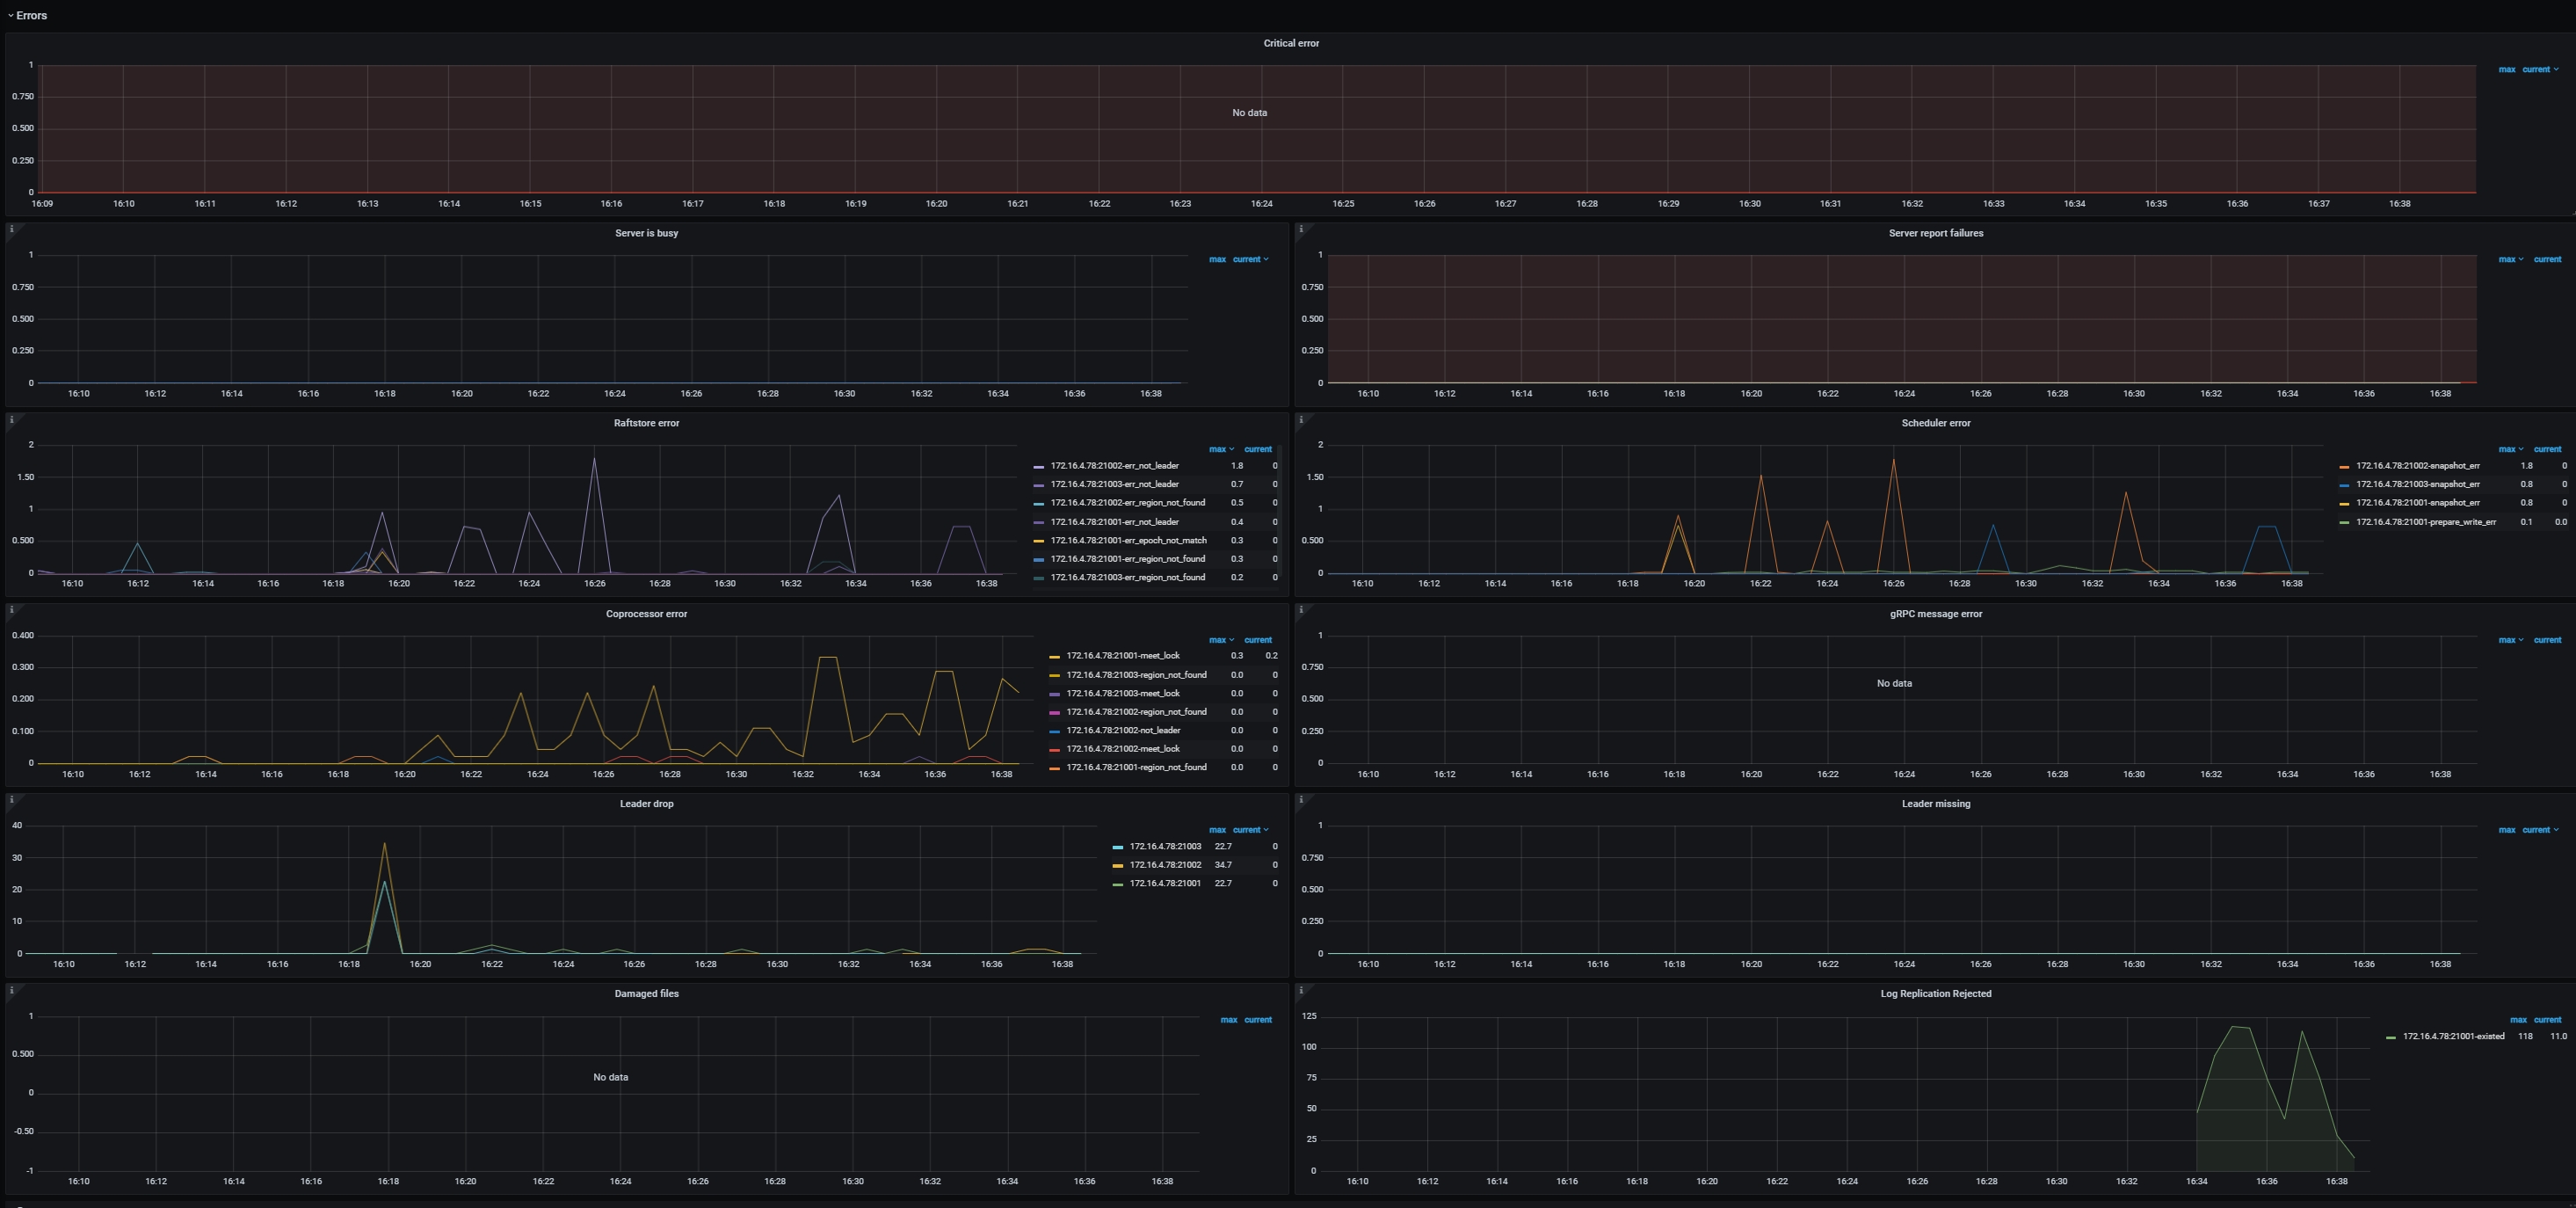
Errors
- Critical error: The number of critical errors
- Server is busy: Indicates occurrences of events that make the TiKV instance unavailable temporarily, such as Write Stall, Channel Full, and so on. It should be
0in normal case. - Server report failures: The number of error messages reported by server. It should be
0in normal case. - Raftstore error: The number of Raftstore errors per type on each TiKV instance
- Scheduler error: The number of scheduler errors per type on each TiKV instance
- Coprocessor error: The number of coprocessor errors per type on each TiKV instance
- gRPC message error: The number of gRPC message errors per type on each TiKV instance
- Leader drop: The count of dropped leaders per TiKV instance
- Leader missing: The count of missing leaders per TiKV instance
- Log Replication Reject: The number of logappend messages rejected due to insufficient memory on each TiKV instance
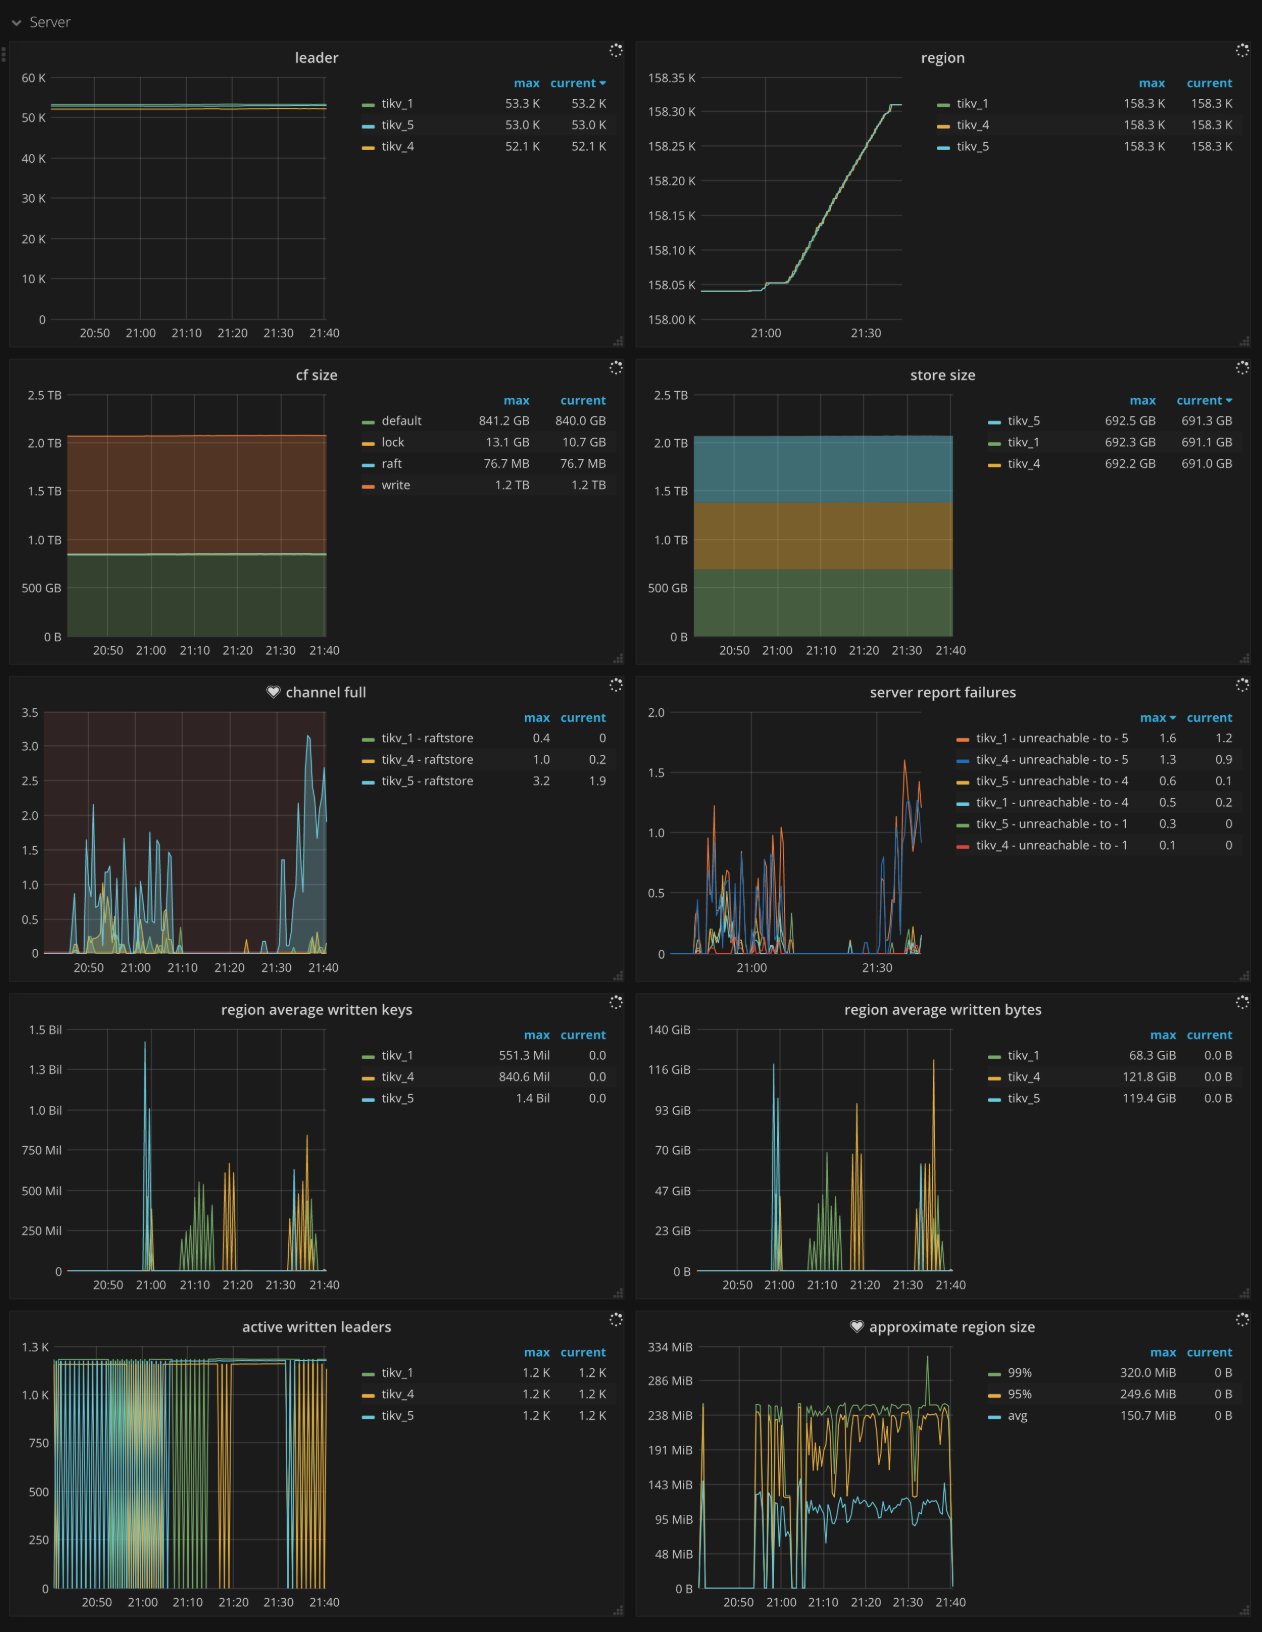
Server
- CF size: The size of each column family
- Store size: The storage size per TiKV instance
- Channel full: The number of Channel Full errors per TiKV instance. It should be
0in normal case. - Active written leaders: The number of leaders being written on each TiKV instance
- Approximate Region size: The approximate Region size
- Approximate Region size Histogram: The histogram of each approximate Region size
- Region average written keys: The average number of written keys to Regions per TiKV instance
- Region average written bytes: The average written bytes to Regions per TiKV instance
gRPC
- gRPC message count: The rate of gRPC messages per type
- gRPC message failed: The rate of failed gRPC messages
- 99% gRPC message duration: The gRPC message duration per message type (P99)
- Average gRPC message duration: The average execution time of gRPC messages
- gRPC batch size: The batch size of gRPC messages between TiDB and TiKV
- Raft message batch size: The batch size of Raft messages between TiKV instances
Thread CPU
- Raft store CPU: The CPU utilization of the
raftstorethread. The CPU utilization should be less than 80% *raftstore.store-pool-sizein normal case. - Async apply CPU: The CPU utilization of the
async applythread. The CPU utilization should be less than 90% *raftstore.apply-pool-sizein normal cases. - Scheduler worker CPU: The CPU utilization of the
scheduler workerthread. The CPU utilization should be less than 90% *storage.scheduler-worker-pool-sizein normal cases. - gRPC poll CPU: The CPU utilization of the
gRPCthread. The CPU utilization should be less than 80% *server.grpc-concurrencyin normal cases. - Unified read pool CPU: The CPU utilization of the
unified read poolthread - Storage ReadPool CPU: The CPU utilization of the
storage read poolthread - Coprocessor CPU: The CPU utilization of the
coprocessorthread - RocksDB CPU: The CPU utilization of the RocksDB thread
- GC worker CPU: The CPU utilization of the
GC workerthread - BackGround worker CPU: The CPU utilization of the
background workerthread
PD
- PD requests: The rate at which TiKV sends to PD
- PD request duration (average): The average duration of processing requests that TiKV sends to PD
- PD heartbeats: The rate at which heartbeat messages are sent from TiKV to PD
- PD validate peers: The rate at which messages are sent from TiKV to PD to validate TiKV peers
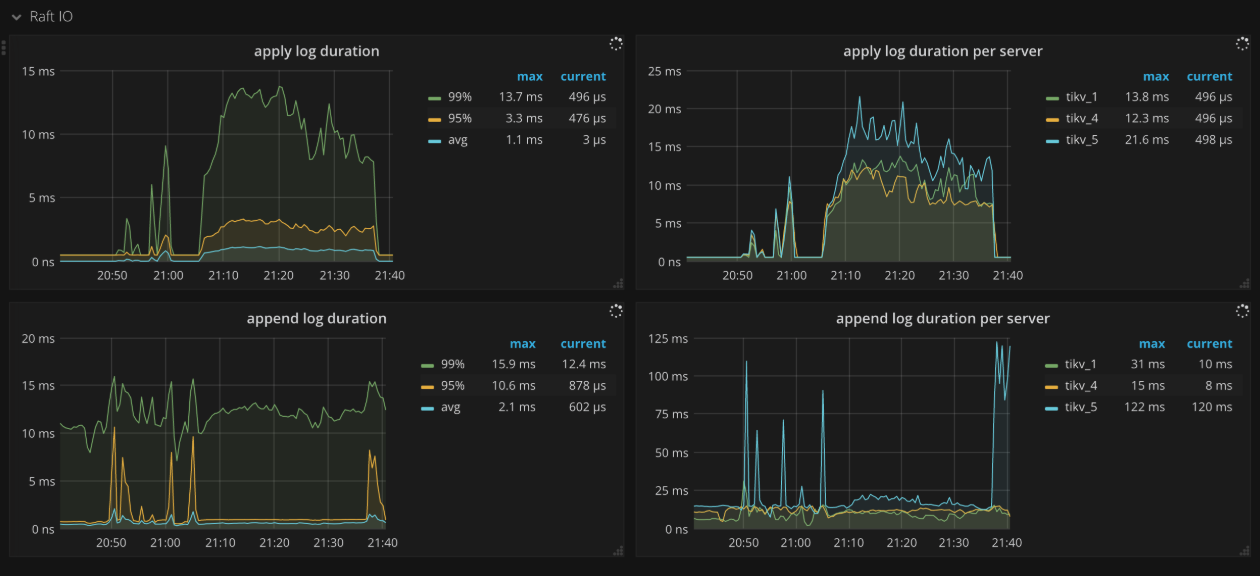
Raft IO
- Apply log duration: The time consumed for Raft to apply logs
- Apply log duration per server: The time consumed for Raft to apply logs per TiKV instance
- Append log duration: The time consumed for Raft to append logs
- Append log duration per server: The time consumed for Raft to append logs per TiKV instance
- Commit log duration: The time consumed by Raft to commit logs
- Commit log duration per server: The time consumed by Raft to commit logs per TiKV instance
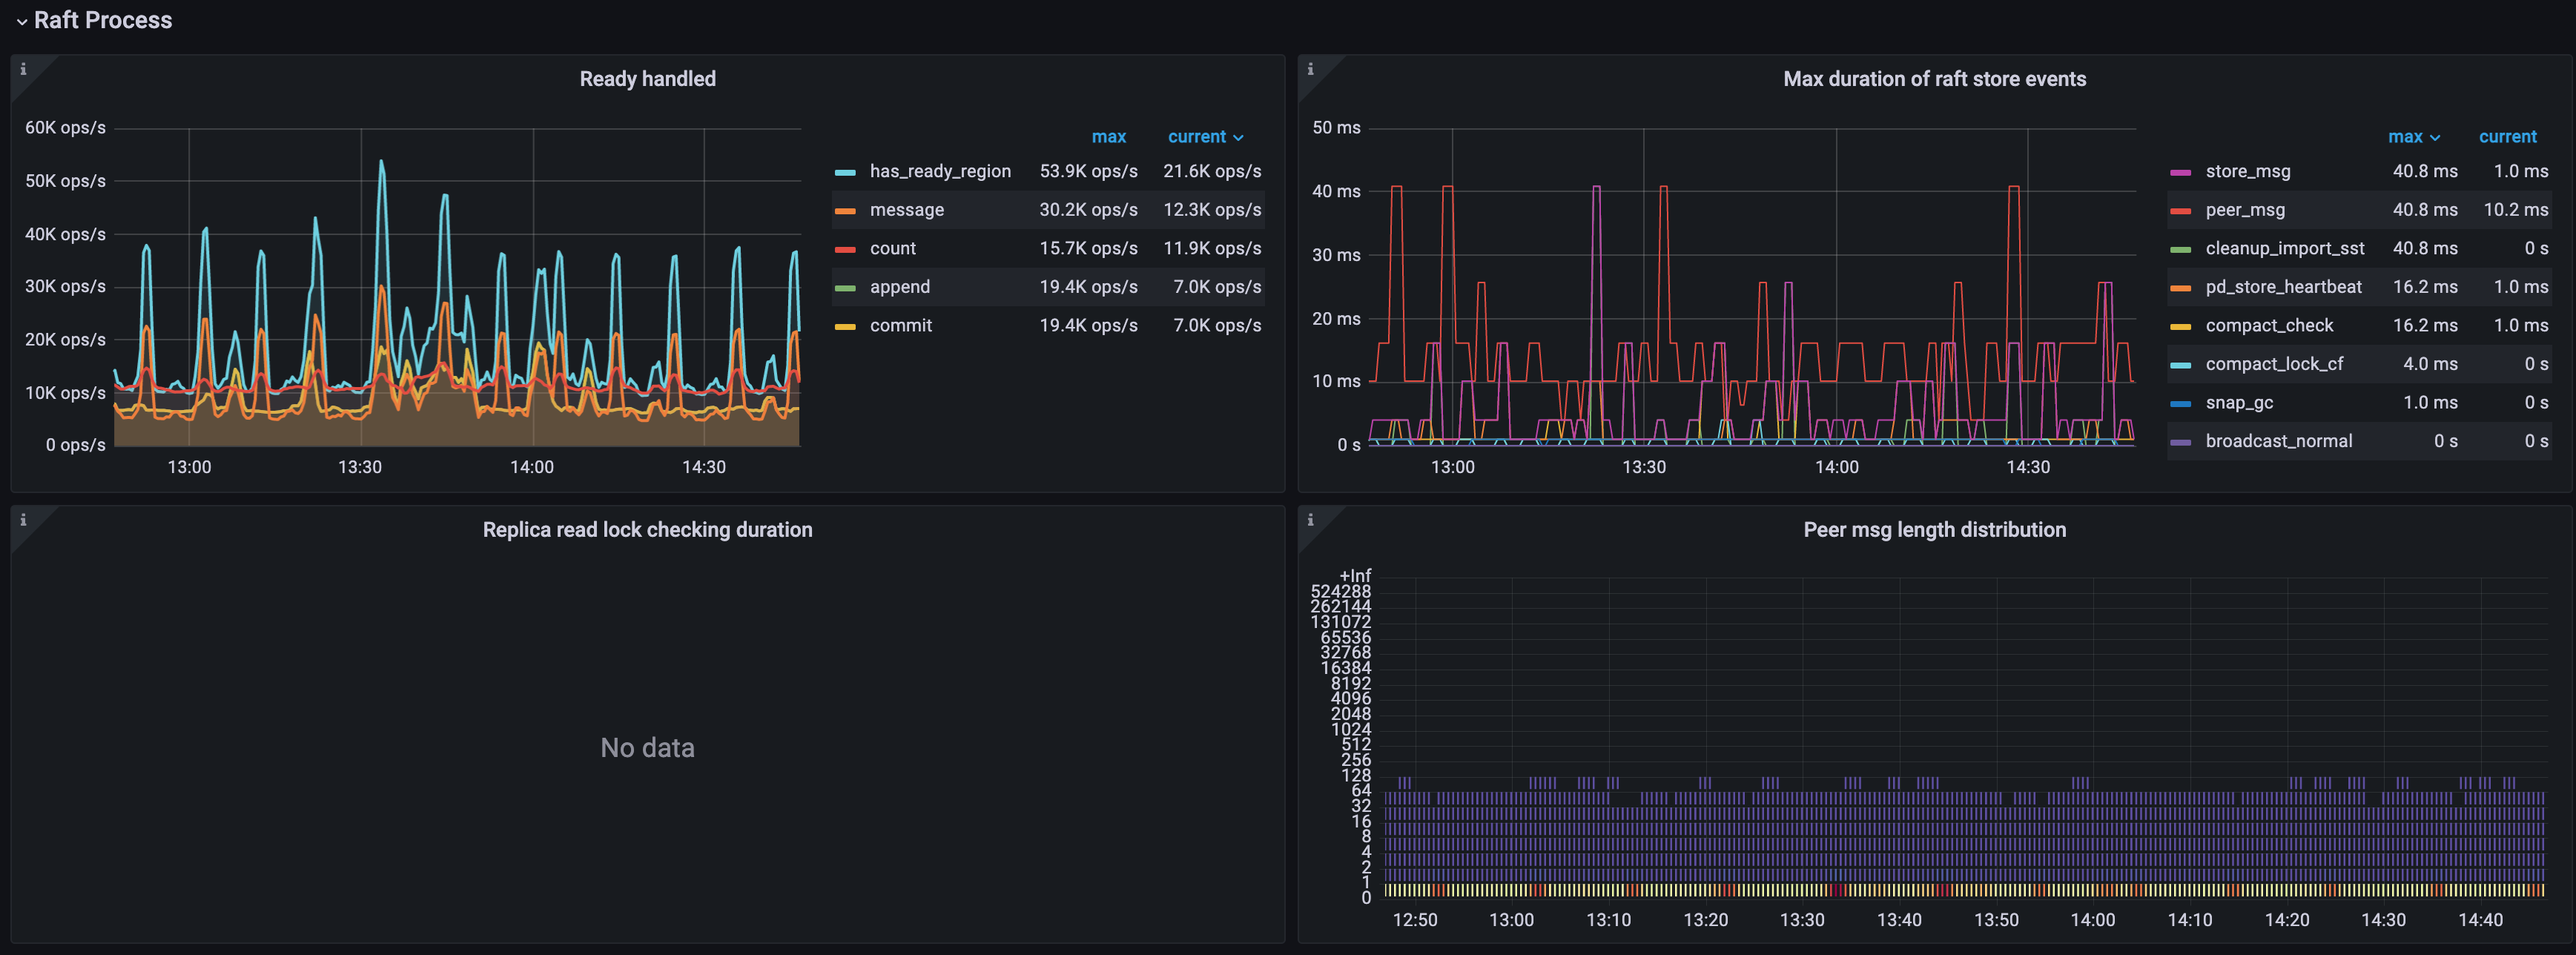
Raft process
- Ready handled: The number of handled ready operations per type per second
- count: The number of handled ready operations per second
- has_ready_region: The number of Regions that have ready per second
- pending_region: The operations per second of the Regions being checked for whether it has ready. This metric is deprecated since v3.0.0
- message: The number of messages that the ready operations per second contain
- append: The number of Raft log entries that the ready operations per second contain
- commit: The number of committed Raft log entries that the ready operations per second contain
- snapshot: The number of snapshots that the ready operations per second contains
- 0.99 Duration of Raft store events: The time consumed by Raftstore events (P99)
- Process ready duration: The time consumed for processes to be ready in Raft
- Process ready duration per server: The time consumed for peer processes to be ready in Raft per TiKV instance. It should be less than 2 seconds (P99.99).
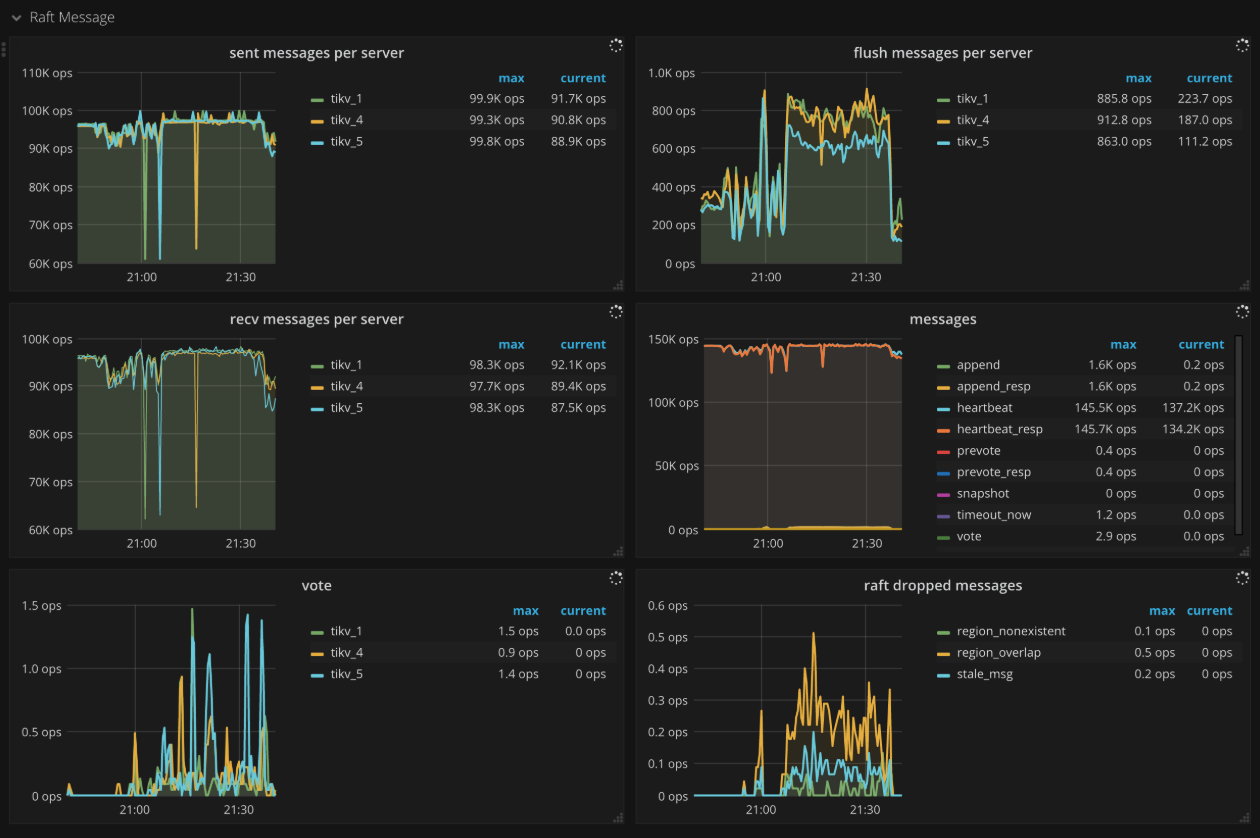
Raft message
- Sent messages per server: The number of Raft messages sent by each TiKV instance per second
- Flush messages per server: The number of Raft messages flushed by the Raft client in each TiKV instance per second
- Receive messages per server: The number of Raft messages received by each TiKV instance per second
- Messages: The number of Raft messages sent per type per second
- Vote: The number of Vote messages sent in Raft per second
- Raft dropped messages: The number of dropped Raft messages per type per second
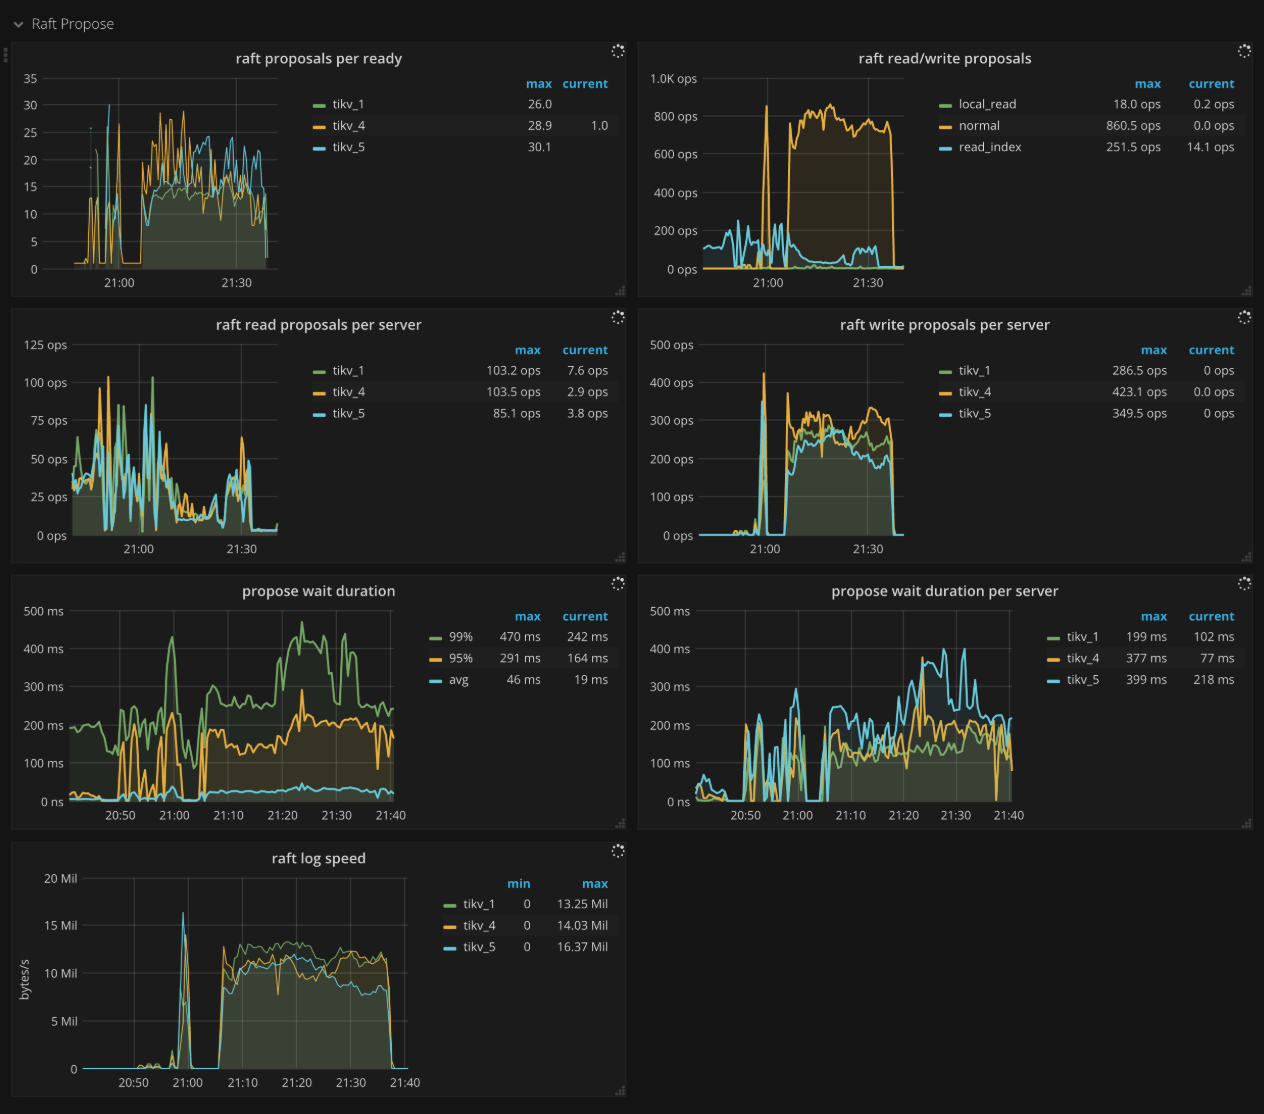
Raft propose
- Raft apply proposals per ready: The histogram of the number of proposals that each ready operation contains in a batch while applying proposal.
- Raft read/write proposals: The number of proposals per type per second
- Raft read proposals per server: The number of read proposals made by each TiKV instance per second
- Raft write proposals per server: The number of write proposals made by each TiKV instance per second
- Propose wait duration: The histogram of waiting time of each proposal
- Propose wait duration per server: The histogram of waiting time of each proposal per TiKV instance
- Apply wait duration: The histogram of apply time of each proposal
- Apply wait duration per server: The histogram of apply time of each proposal per TiKV instance
- Raft log speed: The average rate at which peers propose logs
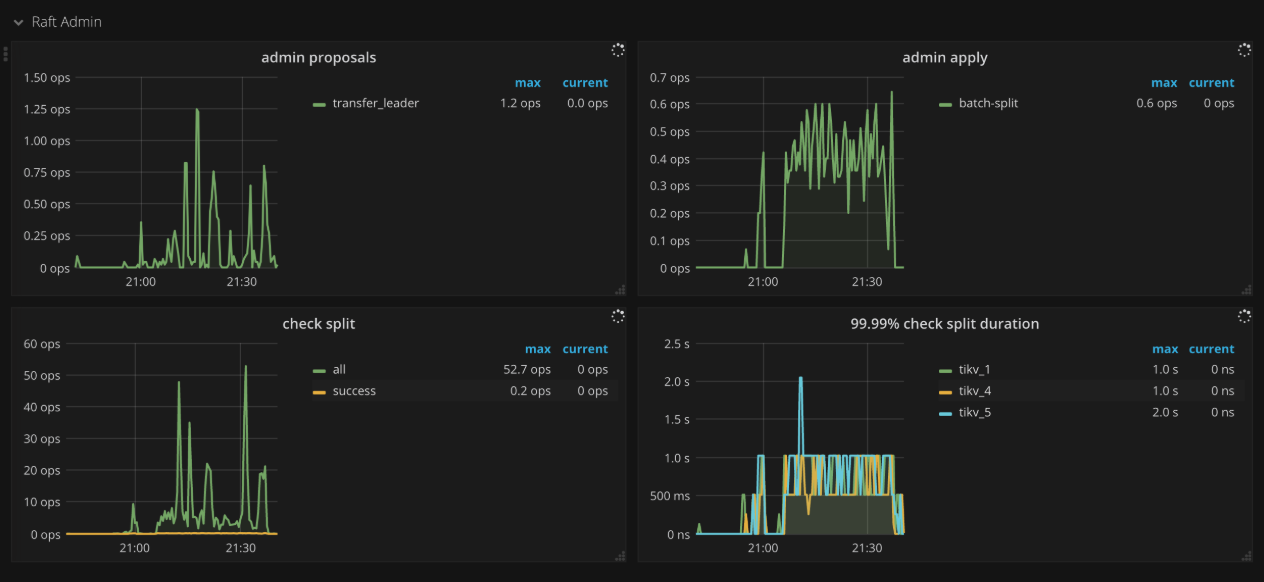
Raft admin
- Admin proposals: The number of admin proposals per second
- Admin apply: The number of processed apply commands per second
- Check split: The number of Raftstore split check commands per second
- 99.99% Check split duration: The time consumed when running split check commands (P99.99)
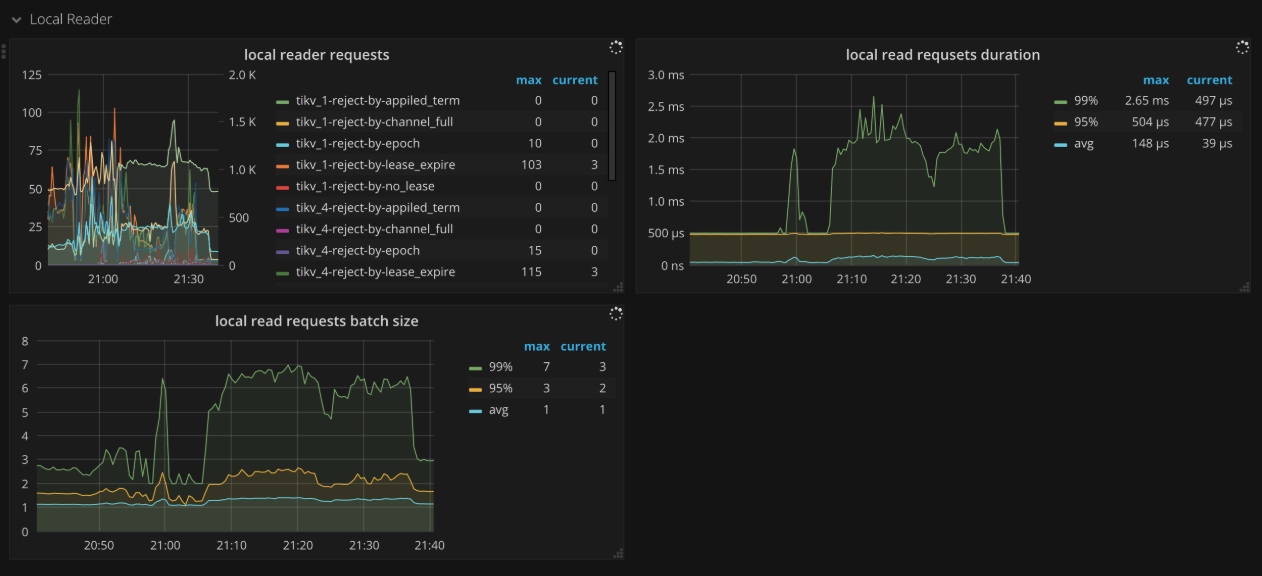
Local reader
- Local reader requests: The number of total requests and the number of rejections from the local read thread
Unified Read Pool
- Time used by level: The time consumed for each level in the unified read pool. Level 0 means small queries.
- Level 0 chance: The proportion of level 0 tasks in unified read pool
- Running tasks: The number of tasks running concurrently in the unified read pool
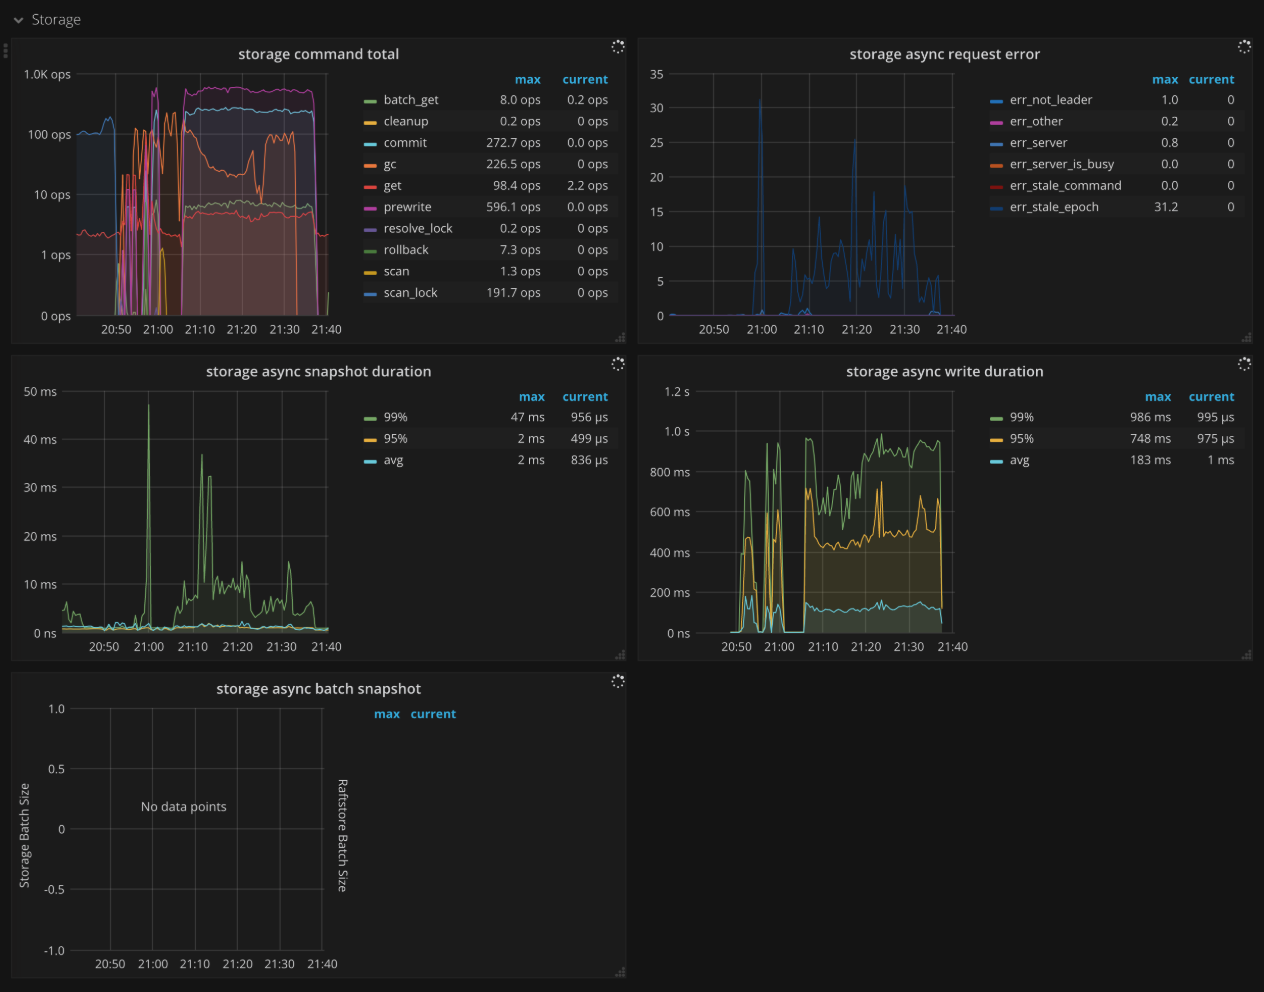
Storage
- Storage command total: The number of received command by type per second
- Storage async request error: The number of engine asynchronous request errors per second
- Storage async snapshot duration: The time consumed by processing asynchronous snapshot requests. It should be less than
1sin.99. - Storage async write duration: The time consumed by processing asynchronous write requests. It should be less than
1sin.99.
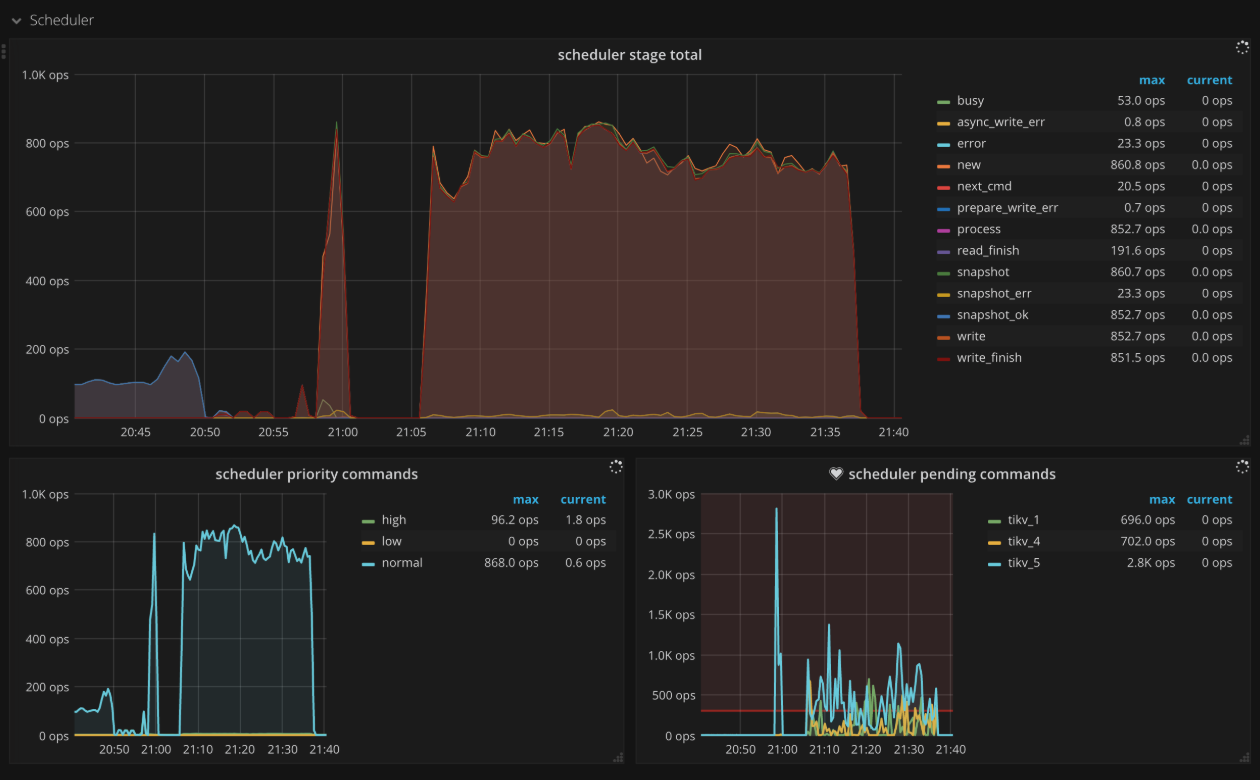
Scheduler
- Scheduler stage total: The number of commands at each stage per second. There should not be a lot of errors in a short time.
- Scheduler writing bytes: The total written bytes by commands processed on each TiKV instance
- Scheduler priority commands: The count of different priority commands per second
- Scheduler pending commands: The count of pending commands per TiKV instance per second
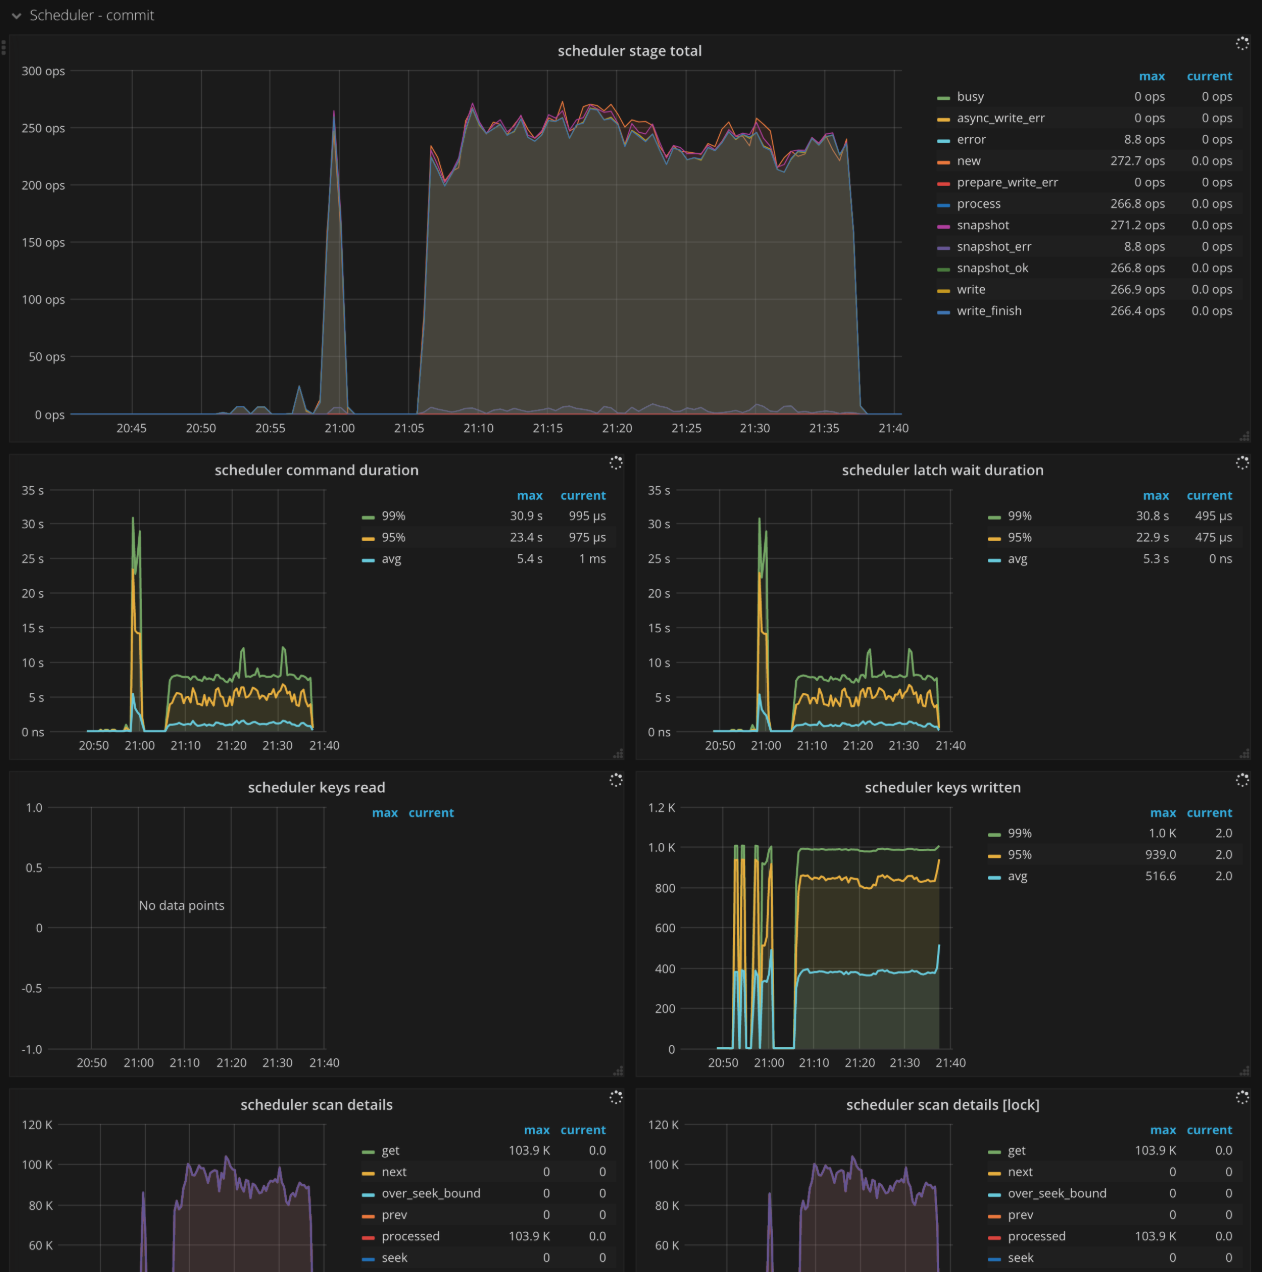
Scheduler - commit
- Scheduler stage total: The number of commands at each stage per second when executing the commit command. There should not be a lot of errors in a short time.
- Scheduler command duration: The time consumed when executing the commit command. It should be less than
1s. - Scheduler latch wait duration: The waiting time caused by latch when executing the commit command. It should be less than
1s. - Scheduler keys read: The count of keys read by a commit command
- Scheduler keys written: The count of keys written by a commit command
- Scheduler scan details: The keys scan details of each CF when executing the commit command.
- Scheduler scan details [lock]: The keys scan details of lock CF when executing the commit command
- Scheduler scan details [write]: The keys scan details of write CF when executing the commit command
- Scheduler scan details [default]: The keys scan details of default CF when executing the commit command
Scheduler - pessimistic_rollback
- Scheduler stage total: The number of commands at each stage per second when executing the
pessimistic_rollbackcommand. There should not be a lot of errors in a short time. - Scheduler command duration: The time consumed when executing the
pessimistic_rollbackcommand. It should be less than1s. - Scheduler latch wait duration: The waiting time caused by latch when executing the
pessimistic_rollbackcommand. It should be less than1s. - Scheduler keys read: The count of keys read by a
pessimistic_rollbackcommand - Scheduler keys written: The count of keys written by a
pessimistic_rollbackcommand - Scheduler scan details: The keys scan details of each CF when executing the
pessimistic_rollbackcommand. - Scheduler scan details [lock]: The keys scan details of lock CF when executing the
pessimistic_rollbackcommand - Scheduler scan details [write]: The keys scan details of write CF when executing the
pessimistic_rollbackcommand - Scheduler scan details [default]: The keys scan details of default CF when executing the
pessimistic_rollbackcommand
Scheduler - prewrite
- Scheduler stage total: The number of commands at each stage per second when executing the prewrite command. There should not be a lot of errors in a short time.
- Scheduler command duration: The time consumed when executing the prewrite command. It should be less than
1s. - Scheduler latch wait duration: The waiting time caused by latch when executing the prewrite command. It should be less than
1s. - Scheduler keys read: The count of keys read by a prewrite command
- Scheduler keys written: The count of keys written by a prewrite command
- Scheduler scan details: The keys scan details of each CF when executing the prewrite command.
- Scheduler scan details [lock]: The keys scan details of lock CF when executing the prewrite command
- Scheduler scan details [write]: The keys scan details of write CF when executing the prewrite command
- Scheduler scan details [default]: The keys scan details of default CF when executing the prewrite command
Scheduler - rollback
- Scheduler stage total: The number of commands at each stage per second when executing the rollback command. There should not be a lot of errors in a short time.
- Scheduler command duration: The time consumed when executing the rollback command. It should be less than
1s. - Scheduler latch wait duration: The waiting time caused by latch when executing the rollback command. It should be less than
1s. - Scheduler keys read: The count of keys read by a rollback command
- Scheduler keys written: The count of keys written by a rollback command
- Scheduler scan details: The keys scan details of each CF when executing the rollback command.
- Scheduler scan details [lock]: The keys scan details of lock CF when executing the rollback command
- Scheduler scan details [write]: The keys scan details of write CF when executing the rollback command
- Scheduler scan details [default]: The keys scan details of default CF when executing the rollback command
GC
- GC tasks: The count of GC tasks processed by gc_worker
- GC tasks Duration: The time consumed when executing GC tasks
- TiDB GC seconds: The GC duration
- TiDB GC worker actions: The count of TiDB GC worker actions
- ResolveLocks Progress: The progress of the first phase of GC (Resolve Locks)
- TiKV Auto GC Progress: The progress of the second phase of GC
- GC speed: The number of keys deleted by GC per second
- TiKV Auto GC SafePoint: The value of TiKV GC safe point. The safe point is the current GC timestamp
- GC lifetime: The lifetime of TiDB GC
- GC interval: The interval of TiDB GC
- GC in Compaction Filter: The count of filtered versions in the compaction filter of write CF.
Snapshot
- Rate snapshot message: The rate at which Raft snapshot messages are sent
- 99% Handle snapshot duration: The time consumed to handle snapshots (P99)
- Snapshot state count: The number of snapshots per state
- 99.99% Snapshot size: The snapshot size (P99.99)
- 99.99% Snapshot KV count: The number of KV within a snapshot (P99.99)
Task
- Worker handled tasks: The number of tasks handled by worker per second
- Worker pending tasks: Current number of pending and running tasks of worker per second. It should be less than
1000in normal case. - FuturePool handled tasks: The number of tasks handled by future pool per second
- FuturePool pending tasks: Current number of pending and running tasks of future pool per second
Coprocessor Overview
- Request duration: The total duration from the time of receiving the coprocessor request to the time of finishing processing the request
- Total Requests: The number of requests by type per second
- Handle duration: The histogram of time spent actually processing coprocessor requests per minute
- Total Request Errors: The number of request errors of Coprocessor per second. There should not be a lot of errors in a short time.
- Total KV Cursor Operations: The total number of the KV cursor operations by type per second, such as
select,index,analyze_table,analyze_index,checksum_table,checksum_index, and so on. - KV Cursor Operations: The histogram of KV cursor operations by type per second
- Total RocksDB Perf Statistics: The statistics of RocksDB performance
- Total Response Size: The total size of coprocessor response
Coprocessor Detail
- Handle duration: The histogram of time spent actually processing coprocessor requests per minute
- 95% Handle duration by store: The time consumed to handle coprocessor requests per TiKV instance per second (P95)
- Wait duration: The time consumed when coprocessor requests are waiting to be handled. It should be less than
10s(P99.99). - 95% Wait duration by store: The time consumed when coprocessor requests are waiting to be handled per TiKV instance per second (P95)
- Total DAG Requests: The total number of DAG requests per second
- Total DAG Executors: The total number of DAG executors per second
- Total Ops Details (Table Scan): The number of RocksDB internal operations per second when executing select scan in coprocessor
- Total Ops Details (Index Scan): The number of RocksDB internal operations per second when executing index scan in coprocessor
- Total Ops Details by CF (Table Scan): The number of RocksDB internal operations for each CF per second when executing select scan in coprocessor
- Total Ops Details by CF (Index Scan): The number of RocksDB internal operations for each CF per second when executing index scan in coprocessor
Threads
- Threads state: The state of TiKV threads
- Threads IO: The I/O traffic of each TiKV thread
- Thread Voluntary Context Switches: The number of TiKV threads voluntary context switches
- Thread Nonvoluntary Context Switches: The number of TiKV threads nonvoluntary context switches
RocksDB - kv/raft
- Get operations: The count of get operations per second
- Get duration: The time consumed when executing get operations
- Seek operations: The count of seek operations per second
- Seek duration: The time consumed when executing seek operations
- Write operations: The count of write operations per second
- Write duration: The time consumed when executing write operations
- WAL sync operations: The count of WAL sync operations per second
- Write WAL duration: The time consumed for writing WAL
- WAL sync duration: The time consumed when executing WAL sync operations
- Compaction operations: The count of compaction and flush operations per second
- Compaction duration: The time consumed when executing the compaction and flush operations
- SST read duration: The time consumed when reading SST files
- Write stall duration: Write stall duration. It should be
0in normal case. - Memtable size: The memtable size of each column family
- Memtable hit: The hit rate of memtable
- Block cache size: The block cache size. Broken down by column family if shared block cache is disabled.
- Block cache hit: The hit rate of block cache
- Block cache flow: The flow rate of block cache operations per type
- Block cache operations: The count of block cache operations per type
- Keys flow: The flow rate of operations on keys per type
- Total keys: The count of keys in each column family
- Read flow: The flow rate of read operations per type
- Bytes / Read: The bytes per read operation
- Write flow: The flow rate of write operations per type
- Bytes / Write: The bytes per write operation
- Compaction flow: The flow rate of compaction operations per type
- Compaction pending bytes: The pending bytes to be compacted
- Read amplification: The read amplification per TiKV instance
- Compression ratio: The compression ratio of each level
- Number of snapshots: The number of snapshots per TiKV instance
- Oldest snapshots duration: The time that the oldest unreleased snapshot survivals
- Number files at each level: The number of SST files for different column families in each level
- Ingest SST duration seconds: The time consumed to ingest SST files
- Stall conditions changed of each CF: Stall conditions changed of each column family
Titan - All
- Blob file count: The number of Titan blob files
- Blob file size: The total size of Titan blob file
- Live blob size: The total size of valid blob record
- Blob cache hit: The hit rate of Titan block cache
- Iter touched blob file count: The number of blob file involved in a single iterator
- Blob file discardable ratio distribution: The ratio distribution of blob record failure of blob files
- Blob key size: The size of Titan blob keys
- Blob value size: The size of Titan blob values
- Blob get operations: The count of get operations in Titan blob
- Blob get duration: The time consumed when executing get operations in Titan blob
- Blob iter operations: The time consumed when executing iter operations in Titan blob
- Blob seek duration: The time consumed when executing seek operations in Titan blob
- Blob next duration: The time consumed when executing next operations in Titan blob
- Blob prev duration: The time consumed when executing prev operations in Titan blob
- Blob keys flow: The flow rate of operations on Titan blob keys
- Blob bytes flow: The flow rate of bytes on Titan blob keys
- Blob file read duration: The time consumed when reading Titan blob file
- Blob file write duration: The time consumed when writing Titan blob file
- Blob file sync operations: The count of blob file sync operations
- Blob file sync duration: The time consumed when synchronizing blob file
- Blob GC action: The count of Titan GC actions
- Blob GC duration: The Titan GC duration
- Blob GC keys flow: The flow rate of keys read and written by Titan GC
- Blob GC bytes flow: The flow rate of bytes read and written by Titan GC
- Blob GC input file size: The size of Titan GC input file
- Blob GC output file size: The size of Titan GC output file
- Blob GC file count: The count of blob files involved in Titan GC
Pessimistic Locking
- Lock Manager Thread CPU: The CPU utilization of the lock manager thread
- Lock Manager Handled tasks: The number of tasks handled by lock manager
- Waiter lifetime duration: The waiting time of the transaction for the lock to be released
- Wait table: The status information of wait table, including the number of locks and the number of transactions waiting for the lock
- Deadlock detect duration: The time consumed for detecting deadlock
- Detect error: The number of errors encountered when detecting deadlock, including the number of deadlocks
- Deadlock detector leader: The information of the node where the deadlock detector leader is located
- Total pessimistic locks memory size: The memory size occupied by the in-memory pessimistic locks
- In-memory pessimistic locking result: The result of only saving pessimistic locks to memory.
fullmeans the number of times that the pessimistic lock is not saved to memory because the memory limit is exceeded.
Memory
- Allocator Stats: The statistics of the memory allocator
Backup
- Backup CPU: The CPU utilization of the backup thread
- Range Size: The histogram of backup range size
- Backup Duration: The time consumed for backup
- Backup Flow: The total bytes of backup
- Disk Throughput: The disk throughput per instance
- Backup Range Duration: The time consumed for backing up a range
- Backup Errors: The number of errors encountered during a backup
Encryption
- Encryption data keys: The total number of encrypted data keys
- Encrypted files: The number of encrypted files
- Encryption initialized: Shows whether encryption is enabled.
1means enabled. - Encryption meta files size: The size of the encryption meta file
- Encrypt/decrypt data nanos: The histogram of duration on encrypting/decrypting data each time
- Read/write encryption meta duration: The time consumed for reading/writing encryption meta files
Explanation of Common Parameters
gRPC Message Type
Transactional API:
- kv_get: The command of getting the latest version of data specified by
ts - kv_scan: The command of scanning a range of data
- kv_prewrite: The command of prewriting the data to be committed at first phase of 2PC
- kv_pessimistic_lock: The command of adding a pessimistic lock to the key to prevent other transaction from modifying this key
- kv_pessimistic_rollback: The command of deleting the pessimistic lock on the key
- kv_txn_heart_beat: The command of updating
lock_ttlfor pessimistic transactions or large transactions to prevent them from rolling back - kv_check_txn_status: The command of checking the status of the transaction
- kv_commit: The command of committing the data written by the prewrite command
- kv_cleanup: The command of rolling back a transaction, which is deprecated in v4.0
- kv_batch_get: The command of getting the value of batch key at once, similar to
kv_get - kv_batch_rollback: The command of batch rollback of multiple prewrite transactions
- kv_scan_lock: The command of scanning all locks with a version number before
max_versionto clean up expired transactions - kv_resolve_lock: The command of committing or rollback the transaction lock, according to the transaction status.
- kv_gc: The command of GC
- kv_delete_range: The command of deleting a range of data from TiKV
- kv_get: The command of getting the latest version of data specified by
Raw API:
- raw_get: The command of getting the value of key
- raw_batch_get: The command of getting the value of batch keys
- raw_scan: The command of scanning a range of data
- raw_batch_scan: The command of scanning multiple consecutive data range
- raw_put: The command of writing a key/value pair
- raw_batch_put: The command of writing a batch of key/value pairs
- raw_delete: The command of deleting a key/value pair
- raw_batch_delete: The command of a batch of key/value pairs
- raw_delete_range: The command of deleting a range of data
Was this page helpful?